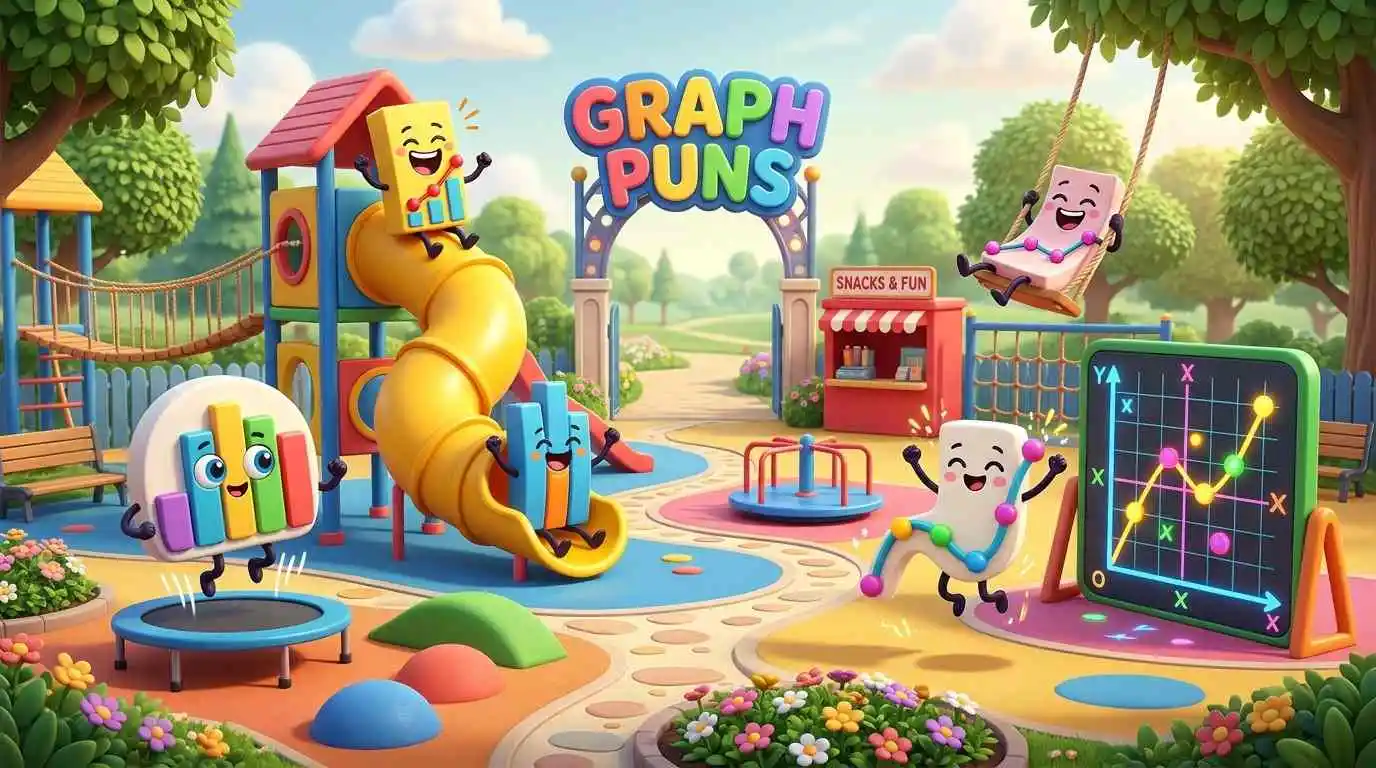
Numbers may explain the facts, but graphs give those facts a shape. Graph Puns add another dimension by turning chart bars, wandering points, and unpredictable curves into little moments of mathematical mischief.
From classroom laughs to clever social media captions, this collection offers short, original wordplay for different kinds of graphs. You’ll find jokes about chart comparisons, plotting blunders, mathematical directions, and the curious personalities hiding inside a dataset.
Bar Graph Puns
Bar graphs compare quantities with vertical bars of different heights. These jokes turn those comparisons into playful observations about competition, growth, and standing out.
- Bars love competition because everyone wants to raise the bar.
- Tall columns enjoy standing out in a crowd.
- Comparisons make bar charts feel a little taller.
- Sales bars celebrate every upward movement with a standing ovation.
- Short columns demand equal-height opportunities.
- Graph bars formed a band but couldn’t agree on their measurements.
- Vertical rectangles have a serious case of high expectations.
- Revenue charts celebrate growth without getting carried away.
- Tiny bars dream of reaching greater heights. 📊
Pie Chart Puns
Pie charts divide information into slices that represent parts of a whole. Their percentages and portions offer plenty of opportunities for delicious mathematical wordplay.
- Slices argue over who deserves the biggest piece.
- Crusty percentages make every pie chart deliciously informative. 🥧
- Fractions love pie charts because everyone gets a portion.
- Circular diagrams always see the whole picture.
- Quarters celebrate because each one gets a fair share.
- Dessert data proves that statistics can be sweet.
- Percentages compete for a bigger slice of attention.
- Round charts never leave anyone completely out of the loop.
- Leftover pie makes the smallest slice feel important.
Line Graph Puns
Line graphs reveal changes and trends by connecting data points. Whether the line rises, falls, or stays flat, its movements can inspire some amusing observations.
- Rising lines have an optimistic outlook.
- Falling trends prefer to take things downhill.
- Flat graphs appreciate a little stability.
- Curving trends make unpredictable plot developments.
- Progress lines celebrate every upward step. 📈
- Horizontal stretches are experts at keeping things level.
- Fluctuating sales charts experience plenty of emotional peaks.
- Connected lines believe every event has a relationship.
- Steady trends never feel the need to show off.
- Winding graphs make the journey more interesting.
Coordinate Plane Puns
A coordinate plane gives every point a location through its horizontal and vertical values. These puns explore the funny side of finding your place and navigating mathematical directions.

- Coordinates never feel lost when they know their position.
- Origins stay humble because they always start at zero.
- Quadrant explorers enjoy seeing things from another angle.
- Negative coordinates have a talent for gloomy directions.
- Wandering points need a map to find their proper place.
- Positioned dots make excellent neighbors on a coordinate plane.
- Mathematical addresses always include the right pair of numbers.
- Traveling coordinates enjoy moving between quadrants.
- Located points take pride in knowing exactly where they stand.
Continue Reading: Math Puns That Make Numbers More Fun for Everyone
X-Axis and Y-Axis Puns
The x-axis runs horizontally, while the y-axis moves vertically. Their different directions and shared intersection make them perfect subjects for geometry-inspired jokes.
- Horizontal lines prefer taking life one step sideways.
- Vertical axes always aim higher. ⬆️
- Intersecting axes know how to meet in the middle.
- Perpendicular partners make a relationship with a right angle.
- Directional lines never lose sight of their purpose.
- Upward axes motivate everyone to rise above expectations.
- Sideways thinkers make the x-axis feel understood.
- Crossing paths gives both axes a common point.
- Straight axes prefer conversations without unnecessary turns.
- Mathematical directions keep every graph on track.
Data Point Puns
Each data point represents an observation or measurement. These jokes celebrate individual values, unusual findings, and the surprising influence a single point can have.
- Observations always have something worth mentioning.
- Outliers prefer making their own rules.
- Evidence-based points never speak without support.
- Isolated dots sometimes need a little context.
- Individual measurements deserve their moment in the spotlight.
- Unexpected values make analysts raise an eyebrow.
- Reliable observations always count on accuracy.
- Missing points leave noticeable gaps in the story.
- Distinct data points prove that individuality matters. 🎯
- Collected values make a stronger case together.
- Unusual measurements bring an unexpected twist to statistics.
Scatter Plot Puns
Scatter plots display individual points to help reveal relationships between variables. Their scattered arrangements, tight clusters, and unusual outliers create plenty of room for clever humor.
- Scattered dots have trouble organizing a group photo.
- Clusters stick together because they enjoy close relationships.
- Outlying observations prefer an independent lifestyle.
- Random patterns keep statisticians guessing.
- Distant points can still share a meaningful connection.
- Dispersed values refuse to follow the crowd.
- Grouped dots make a close-knit neighborhood.
- Unexpected clusters turn ordinary charts into mysteries.
- Widely spread observations need extra personal space.
- Unpredictable points make statistical dating complicated. 😄
- Correlations help scattered strangers discover common ground.
- Independent dots bring character to a crowded plot.
- Statistical rebels enjoy standing apart from the majority.
Slope and Intercept Puns
Slope describes a line’s steepness and direction, while the intercept marks where it crosses an axis. These mathematical features inspire jokes about progress, starting points, and unexpected angles.
- Positive slopes always look on the bright side.
- Negative inclines expect everything to go downhill.
- Intercepts make introductions at the perfect starting point.
- Zero slopes prefer staying exactly where they are.
- Steep inclines take every challenge to another level.
- Gradient enthusiasts know how to rise to the occasion.
- Y-intercepts enjoy meeting lines right from the beginning.
- Downhill slopes make excellent ski instructors. ⛷️
- Linear relationships appreciate a little rise and run.
- Changing gradients keep mathematicians on their toes.
- Starting points believe first impressions really count.
- Gentle inclines never rush their progress.
Graph Paper Puns
Graph paper uses a grid of evenly spaced lines to help with plotting, measuring, and drawing. Its tidy squares and orderly layout provide inspiration for jokes about structure and creativity.
- Squares enjoy keeping everything neatly boxed.
- Grids make organization look like a fine art.
- Rulers trust graph paper to keep things straight.
- Tiny boxes dream of thinking outside themselves.
- Measured layouts give creativity a solid foundation.
- Notebooks love graph paper because every idea has a place.
- Margins provide a little breathing room for busy grids.
- Architects appreciate paper that has everything mapped out.
- Chessboards admire graph paper’s square-by-square thinking.
- Sketches become more organized when grids join the picture.
- Neat little boxes make planning less complicated.
- Geometric squares believe every inch counts. ✏️
Histogram Puns
Histograms organize numerical data into intervals called bins, showing how frequently values occur. Their crowded columns and empty ranges make sorting statistics surprisingly entertaining.

- Bins keep numerical values in their proper places.
- Frequencies make the tallest column feel popular.
- Empty intervals complain about having nothing to do.
- Grouped measurements enjoy staying within their limits.
- Distribution charts organize numbers into neat neighborhoods.
- Crowded bins desperately need some breathing room.
- Numerical ranges make excellent boundaries.
- Sorting measurements is a histogram’s favorite pastime.
- Uneven frequencies create a little competition between bins.
- Packed intervals have no room for extra numbers.
- Statistical storage works best when every value has a place.
- Counted observations make every bin feel appreciated.
Continue Reading: Number Puns That Make Every Digit Count Twice Today
Graphing Mistake Puns
Even a carefully planned graph can go wrong because of incorrect scales, mislabeled axes, or misplaced points. These jokes turn common plotting blunders into lighthearted mathematical mishaps.
- Mislabeling an axis gives the chart an identity crisis.
- Decimal disasters turn tiny errors into huge surprises.
- Incorrect scales make the truth look out of proportion.
- Switched axes leave the entire presentation upside down.
- Missing legends turn colorful lines into suspects.
- Wrong coordinates send data points on an unexpected detour.
- Careless plotting makes accuracy lose its footing.
- Forgotten labels leave readers guessing about the evidence.
- Accidental curves give straight facts a confusing twist.
- Faulty calculations make the graph’s credibility fall.
- Misplaced dots create a point of confusion.
- Shaky sketches give statistics a wobbly reputation.
- Confused scales make small changes look enormous. 😅
- Errant lines can lead conclusions in the wrong direction.
Plotted Curve Puns
Plotted curves show how values change and interact across a graph. From smooth arcs to dramatic peaks, their shapes inspire wordplay about life’s twists, turns, and unexpected developments.
- Parabolas enjoy life because they always find a turning point.
- Wavy curves love riding the mathematical surf. 🌊
- Exponential growth gets exciting before anyone can blink.
- Bell curves bring everyone together around the peak.
- Asymptotes believe in getting close without crossing boundaries.
- Smooth arcs handle life’s bends with grace.
- Cubic curves enjoy stories with unexpected twists.
- Flexible plots know how to bend without breaking.
- Rounded paths make straight-line thinkers reconsider their options.
- Dramatic curves always know how to make an entrance.
- Twisting trajectories keep every mathematical journey interesting.
- Descending arcs prefer a graceful exit.
- Curved lines prove that not every path needs to be straight.
- Turning points remind everyone that change can begin anywhere.
- Undulating plots give mathematics a wave of personality.
Making Graph Humor Work for Any Occasion
The right graph pun depends on your audience, the chart, and where you plan to share it. A classroom joke can highlight a mathematical concept, while a short caption can make a data-themed post more memorable.
- School assignments: work well with coordinate, slope, and plotting jokes that connect to the lesson.
- Business presentations: suit bar-chart humor about growth, comparisons, and changing figures.
- Social media captions: benefit from quick scatter-plot jokes or playful references to unexpected curves.
- Classroom activities: become more engaging with data-point puns that encourage students to think about observations.
- Birthday cards: pair nicely with pie-chart jokes about slices and percentages.
- Professional slides: benefit from subtle wordplay that adds personality without distracting from the data.
Choose a pun that matches the chart’s actual shape, trend, or purpose. A relevant punchline feels more natural, is easier to understand, and gives readers a reason to smile while learning something about graphs.

Benjamin Harrison writes puns and jokes spanning animal humor, food wordplay, seasonal occasions, trending topics, and entertainment. Over five years in the niche, he has honed joke concepts by comparing punchline options, tightening setups, and adjusting word choices for sharper timing. He also edits themed collections, checks their structure, and updates wording where needed.